Carrying capacity
n., plural: carrying capacities
[ˈkɛɹiɪŋ kəˈpæsɪti]
Definition: The maximum number of individuals of a species that an environment can support
Table of Contents
Carrying Capacity Definition
What is carrying capacity? In biology and environmental science, the carrying capacity of a biological species in a particular habitat refers to the maximum number of individuals (of that species) that the environment can carry and sustain, considering its geography or physical features.
In ecology, carrying capacity is measured as the maximum load of an environment. (Ref.1) The physical features present in the environment act as limiting factors (e.g. food, water, competition, etc.). Thus, the population limit can be expected to depend on these factors. In essence, food availability is an important variable as it affects the population size of the species. It does so in such a way that if food demand is not met over a given period of time the population size will eventually decrease until the resources become adequate. By contrast, when food supply exceeds demand then the population size will soon increase and will stop increasing when the source is consequently depleted.
Carrying capacity may also be defined as the population size at which the population growth rate equals zero. (Ref.2) It should not be confused with the term, equilibrium population, which is defined as a population in which the gene frequencies have reached an equilibrium between mutation pressure and selection pressure. (Ref.3)
In archeology, carrying capacity pertains to the size and density of ancient populations as supported by a given region. (Ref.4) In this field of science, the maximum population over a particular period determines the carrying capacity of that environment. Studies on human history, though, provide evidence that the concept in which the human population size reaches the maximum level is relatively not that common. Most of the time, the population density of humans adjusts, especially as the actual food production fluctuates for that area or region. (Ref.4)
Carrying Capacity Graph
The picture below shows an example of a carrying capacity graph (Figure 1). Here, the carrying capacity (symbol: K) for a biological species is marked by the red dotted horizontal line to describe the number of organisms that the environment can support sustainably for a given time.
Notice that it coincides with the stable equilibrium, which refers to the population size that has reached a steady state as it aligns with the carrying capacity. This point indicates “zero-growth”. The growth is depicted as S-shaped (a characteristic of logistic growth). The S-shape logistic growth forms when the growth rate is slow at first (lag phase) and next speeds up (exponential phase). Then, the rate slows down again as the population size reaches carrying capacity.
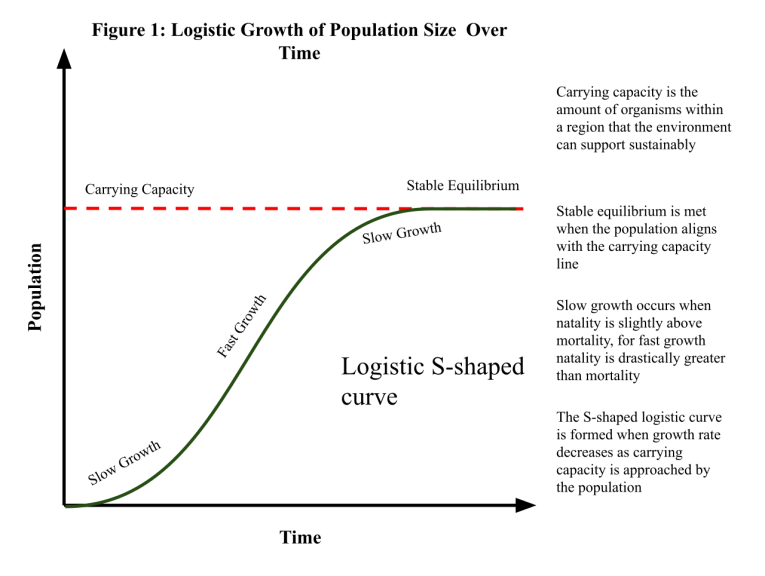
In the real world, though, population size tends to rise and dip in oscillations from the carrying capacity rather than a flat line as depicted in the graph.
To calculate the carrying capacity (K), the equation for the change in population size can be used for deriving a formula for K (Ref.5):


where r is the intrinsic rate of increase,
N is the population size,
and dN/dt is the change in population size.
A sample worksheet of carrying capacity and population biology can be found here.
Carrying Capacity of an Ecosystem
Populations grow at a rate limited by the availability of the Earth’s resources. A population may grow at a faster rate and follow a J-shaped curve. When the birth rate surpasses the death rate of the species, this results in exponential growth. However, this trend soon changes as resources become limited. The growth rate slows down.
Soon, it reaches a stable equilibrium where biomass in the given area seems unchanged over a certain period of time. At this point, the death rate appears to be compensated by the birth rate within a population. This means the per capita birth rate equals the per capita death rate. (Ref.2)
By contrast, when deaths appear to outgrow births, this indicates that the carrying capacity has been exceeded. This is a case of overshoot. The population may go below the carrying capacity. This can occur, for instance, during disease and parasitic outbreaks.
Several factors affect the carrying capacity of an ecosystem. These factors include food supply, water supply, habitat space, competition (intraspecific and interspecific), physical factors (e.g. extreme heat, drought, etc.), chemical factors (e.g. pH, mineral deficiency, etc.), and anthropogenic factors. The sum of these factors that end up restricting the biotic potential of a species is referred to as environmental resistance.
Carrying Capacity Examples
Turtle population
In nature, the population of a given area may reach carrying capacity when the maximum population size is reached for a given area with limited resources.
For example, a pond inhabited initially by ten turtles will be sustainable for the species’ population. Because water, food, and space abound, the turtles can thrive and reproduce at an exponential rate. However, as the population grows, competition is intensified as well. Turtles compete for food, water, and space.
Male turtles compete with other males for mates. These factors will limit the biotic potential of the turtles. When the population seems stable, e.g. at a population of 100 turtles, then, it can be said that the carrying capacity for that area is 100 turtles.
Forest population
Another example is the tree population in a forest. Let’s say a forest can have a carrying capacity of about a hundred trees. This means that the trees can grow without fiercely competing for sunlight, nutrients, and space. This also implicates that the new sprouts may not be able to thrive in the same manner because the tall and older trees will cast a shadow over them, making sunlight hard to access from down below.
How Humans Change Carrying Capacity
Factors that Govern Changes in Carrying Capacity
Humans create sub-populations with different needs according to lifestyle. For example, some of them follow an omnivorous diet whereas others are strictly vegan. Because of this, the demand for food resources may vary. Humans have also found ways to solve and curb competition on resources, such as space, food, and water through technology.
For example, agriculture and husbandry helped expand the food supply. Humans learned to plant crops and breed animals to meet demands for food. They also learned eventually to build a safe shelter away from predators. However, certain modern technology and anthropogenic activities cause critical damage to the population of other species. Some forests and terrestrial habitats were cleared to build houses and establishments.
Pesticides intended for killing off pests from crops leached nutrients off the soil during rain and irrigation. Bodies of water became polluted because of improper waste disposal.
Nature has many factors that limit population growth. Thus, despite technological advancement to limit resource competition, the human population has to deal with other variables. Examples of such variables are sanitation, diseases, outbreaks, and medical care.
Ecological Footprint
Based on Earth’s demographic facts and research study figures, the global carrying capacity for humans is estimated to be nine to ten billion people. (Ref.6) The world’s population is nearly 8 billion.
How long can the Earth sustain the human population? Is it in the carrying capacity level or in the overshoot? The ecological footprint may be used as a basis for finding answers. It is a measure of the human demand on nature using an ecological accounting system. On a global scale, it can help assess demand over what the planet can renew. And according to studies, the Earth has been in an ecological overshoot.
Humans use more resources as well as produce waste at a rate faster than the ecosystem can “heal” or renew. 85% of humanity lives in ecological-deficit countries — where the ecological footprint for consumption surpasses the biocapacity of those countries. (Ref.7)
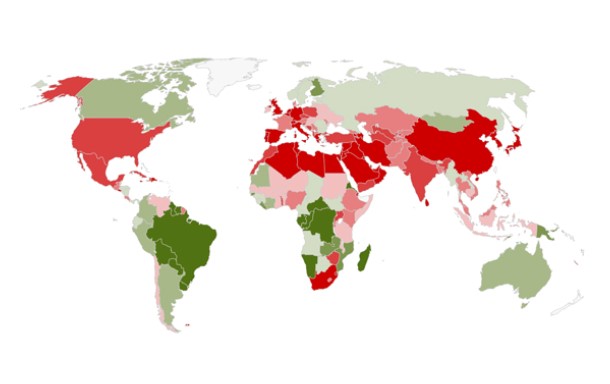
(Image credit: Footprintnetwork.org)
Answer the quiz below to check what you have learned so far about carrying capacity.
Further Reading
References
- Hui, C (2006). “Carrying capacity, population equilibrium, and environment’s maximal load”.Ecological Modelling 192: 317–320.
- McGinley, M. (2013). Carrying capacity. Retrieved from http://www.eoearth.org/view/article/150943
- equilibrium population. (n.d.) McGraw-Hill Dictionary of Scientific & Technical Terms, 6E. (2003). Retrieved from http://encyclopedia2.thefreedictionary.com/equilibrium+population
- Search Results | Archaeology Wordsmith. (2020). Archaeologywordsmith.Com. https://archaeologywordsmith.com/search.php?q=carrying%20capacity
- Socratic, How do you determine carrying capacity? (2016, June 15). How do you determine carrying capacity? | Socratic. Socratic.Org. https://socratic.org/questions/how-do-you-determine-carrying-capacity
- Wolchover, N. (2011, October 11). How Many People Can Earth Support? Livescience.Com; Live Science. https://www.livescience.com/16493-people-planet-earth-support.html
- Countries – Global Footprint Network. (2016). Footprintnetwork.Org. https://www.footprintnetwork.org/our-work/countries/
©BiologyOnline. Content provided and moderated by BiologyOnline Editors.

