Ecological Research: Measuring & Analysis

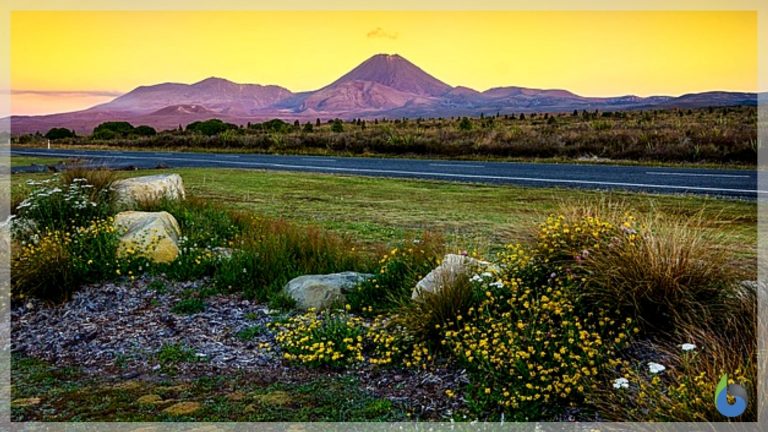
North Island, New Zealand
Table of Contents
Previously in this lesson, we learned that high biodiversity is essential to a healthy ecosystem. Thus, monitoring the biodiversity and the sustainability of the ecosystem is crucial. By measuring biodiversity, we can determine the kinds and the number of species present in an ecosystem. Below are some of the methods commonly used in measuring biodiversity.
Quadrat and Transect Sampling
One of the techniques for gathering data and measuring biodiversity is by using quadrats. Quadrats are frames used to measure the percentage cover of particular species. They are traditionally square in shape. The quadrats can range in size — from 1 sq.m to 20 sq.m. The size will depend on the habitat being surveyed. (Ref. 1) To do a quadrat sampling, set the quadrat in place and then count the species within the quadrat. Quadrats should be placed randomly to avoid bias. Many quadrat sampling can be done throughout the area to obtain more reliable data for an accurate representation of biodiversity. (Ref. 2) Quadrat sampling is suitable for determining how many organisms are there in a habitat. Check this Source to learn how to make and set up a 1 sq.m quadrat.
The transect sampling technique uses a transect line. The line can be a rope or a measuring tape that has been marked at set intervals, for example at every meter. At each interval, the type and the number of a particular species along the line are determined and recorded. (Ref. 1)
The video below explains how to do random sampling using quadrats and transect sampling.
Canopy Fogging
Canopy fogging is used for measuring the biodiversity of insects as well as learning about their life cycle. To do this, a low dose of insecticide is sprayed up into the tree. This will cause the insects to fall over a large funnel-shaped screen. The insects are collected for identification and quantification. (Ref. 1)
Netting
Using fine-mesh nets, animal species, such as birds or fish, are captured and then identified. Tagging may also be done on captured species. Or, blood is drawn for genetic analysis. (Ref.1)
Biodiversity Index
One of the ways to calculate for the biodiversity index is to divide the number of species in the ecosystem by the total number of individual organisms in the ecosystem. The closer the biodiversity index is to 1, the higher is the biodiversity of that ecosystem. (Ref. 1, 4) For example, in Forest X, biodiversity sampling recorded 5 plant species: palm tree, fern, conifer tree, moss, and angiosperm. In particular, there are 2 palm trees, 2 ferns, 2 conifers, 2 mosses, and 2 angiosperms. Taking the sum of all individual organisms, we have 2 + 2 + 2 + 2 + 2 = 10. To calculate for the biodiversity index, we divide the number of species (which is 5) by the total number of individual organisms (which is 10). Therefore, 5/10 = 0.5. The biodiversity index is 0.5.
Measuring Species Diversity
Determining diversity indices can also be determined by incorporating species richness and species abundance. Species richness refers to the number of different species in a particular area. In the example given in the previous section, the species richness of Forest X is five (plant species: palm tree, fern, conifer tree, moss, and angiosperm).
Determining species richness, sometimes, is not enough to tell the biodiversity status of an ecosystem. For example, Forest Y has the same five plant species: 1 palm tree, 1 fern, 1 conifer, 1 moss, and 6 angiosperms. In this case, the angiosperms are most abundant. Comparing Forest Y with Forest X, Forest X is more diverse because the abundance of the species is the same. This leads us to another interesting concept: species abundance.
Species abundance is the relative abundance of the species. It tells how common a species is in the ecosystem. In Forest X, the % relative abundance of the species is 20% (from 2/10 x 100%). In Forest Y, the % relative abundance of the angiosperms is 60% and the rest of the species, (10%). To learn more about species richness and species abundance, watch the video below.
Other examples of diversity indices are the Shannon-Wiener Index, which is the most commonly used index in ecological studies, and Simpson’s Index, which is a measure of dominance. Similarity indices are a measure of the similarity between communities based on species composition. (Ref. 5) For formulas, view this Source.
In the next lesson, let’s learn about mātauranga Māori, the knowledge of the indigenous people of New Zealand, what it means, and its role in science.
References:
1. Key Terms. (n.d.). https://tools.mheducation.ca/web_resources/sch/ON_Sci_9_Unit1_Sec31.pdf
2. Making and using a quadrat. (2017). Science Learning Hub. https://www.sciencelearn.org.nz/resources/2318-making-and-using-a-quadrat
3. Measuring Biodiversity Using Beans as a Model. (2019, January 20). Biology LibreTexts. https://bio.libretexts.org/Bookshelves/Ancillary_Materials/Worksheets/Book%3A_The_Biology_Corner_(Worksheets)/Ecology/Measuring_Biodiversity_Using_Beans_as_a_Model
4. How to Calculate a Biodiversity Index | AMNH. (2020). American Museum of Natural History. https://www.amnh.org/learn-teach/curriculum-collections/biodiversity-counts/plant-ecology/how-to-calculate-a-biodiversity-index
5. Measuring Species Diversity. (n.d.). Retrieved August 19, 2020, from https://www.webpages.uidaho.edu/range357/notes/diversity.pdf
You will also like...

Physical Development in Humans
This tutorial elaborates on the physical development of humans, particularly from puberty to adulthood. Read this tutori..

Non-Mendelian Inheritance
In this tutorial, find out more about certain types of inheritance that does not follow the Mendelian inheritance patter..

The Evolutionary Development of Multicellular Organisms
Multicellular organisms evolved. The first ones were likely in the form of sponges. Multicellularity led to the evolutio..

Kidneys and Regulation of Water and Inorganic Ions
The kidneys are responsible for the regulation of water and inorganic ions. Read this tutorial to learn about the differ..

The Hominids
The hominid family diversified from the apes around 6 to 8 million years ago. Since then, the evolutionary path has prov..

Respiration
The human respiratory system is an efficient system of inspiring and expiring respiratory gases. This tutorial provides ..
